1
Valuations shift. Someone breaks a league record and a prospect's value jumps overnight. You're hunting for those moments.
Sponsorship Strategy
Big contracts, real market dynamics, and the timing windows that matter. Winners know when to move.
You're sitting on $2M spread across athlete deals, team partnerships, and event investments. Your competition just grabbed a top-tier athlete at prices that sting. Four weeks until the playoffs close out. Your current ambassador's sentiment just dropped 30 points on Twitter—is that the end or just noise? Activebrand gets you into the actual decision-making. Athlete valuations that shift with the market. Audience overlap down to exact percentages. Real-time sentiment across all platforms. Competitive tracking on where other budgets are flowing. You'll close deals, predict what athletes are worth, and figure out which timing mistakes cost you serious money.
Three-point-two million spread across four cycles. You're watching allocation decisions ripple forward, timing shifts that reshape the board and competitive moves that force you to react right now. This is what sponsor strategy actually looks like when you move past the numbers in a spreadsheet.
Valuations shift. Someone breaks a league record and a prospect's value jumps overnight. You're hunting for those moments.
Your competitor just dropped nearly a million on a tier-2 athlete you had your eye on. Do you go after them anyway or find someone else nobody's looking at?
Sentiment shows you where the actual energy is. TikTok's climbing. Instagram's flat. Reddit's turning. You've got about six weeks to figure out what that means.
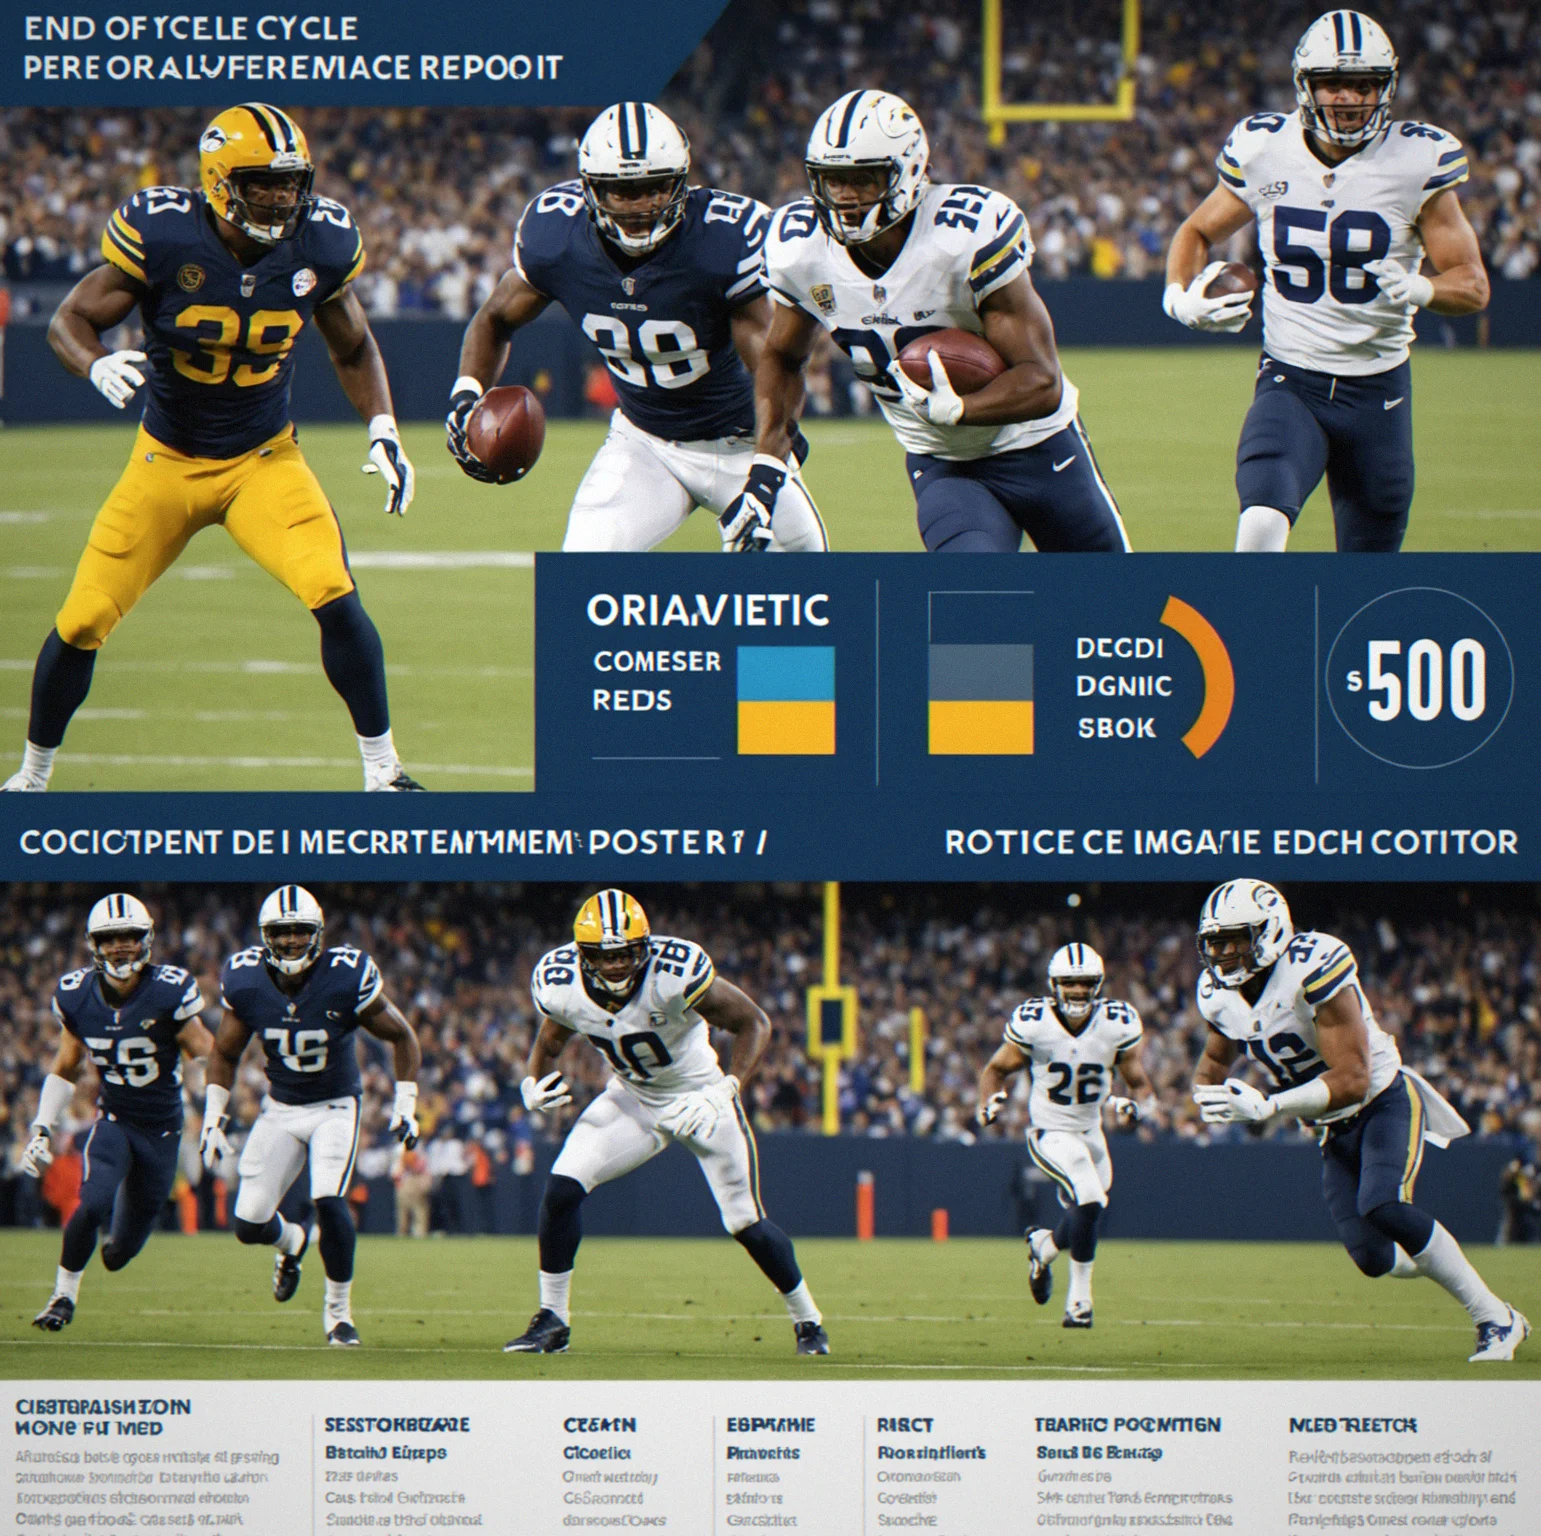
The numbers at the end matter. You hit your reach targets and came in under the cost benchmark by a comfortable margin. Then one athlete's sentiment tanked mid-cycle, so you're already planning different moves for the next round.
Every cycle is different. Run enough of them and you start predicting market moves before they happen.
Tier 1 athletes cost you millions. Tier 2 ranges somewhere between 400k and 1.2 million. The thing about tier 2 is the growth can be brutal. Hit the right moment and a name worth 600k becomes worth nearly 2 million in two months. Miss it and you overpaid. The game teaches you where the real value is headed and what actually moves it.
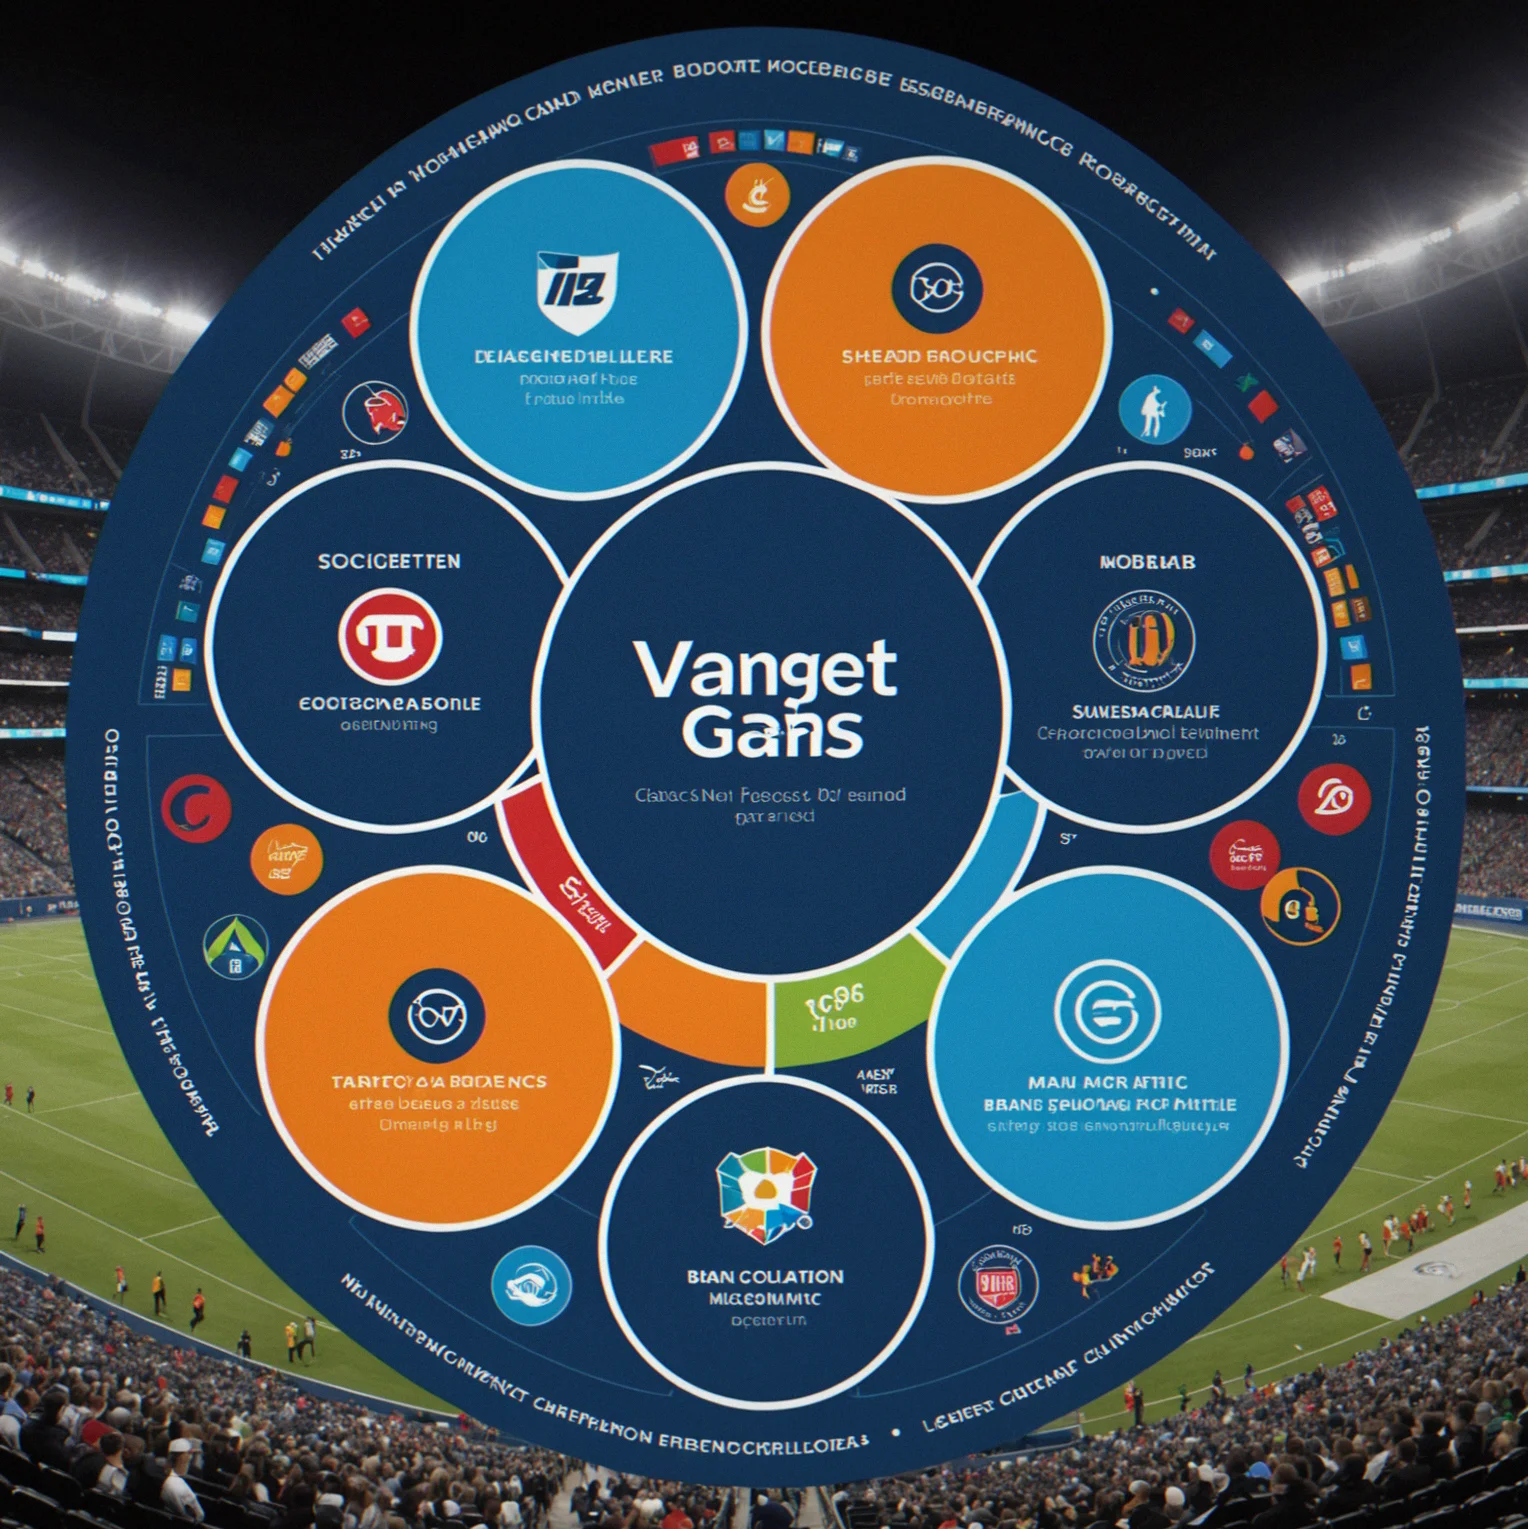
You're not buying athletes because they're likeable. You buy them for their followers. When 40% of an athlete's audience matches your target demographic, your cost per qualified impression gets worse compared to someone at the same price with 70% overlap. The game forces you to actually calculate this across your whole portfolio instead of just signing names that sound right.
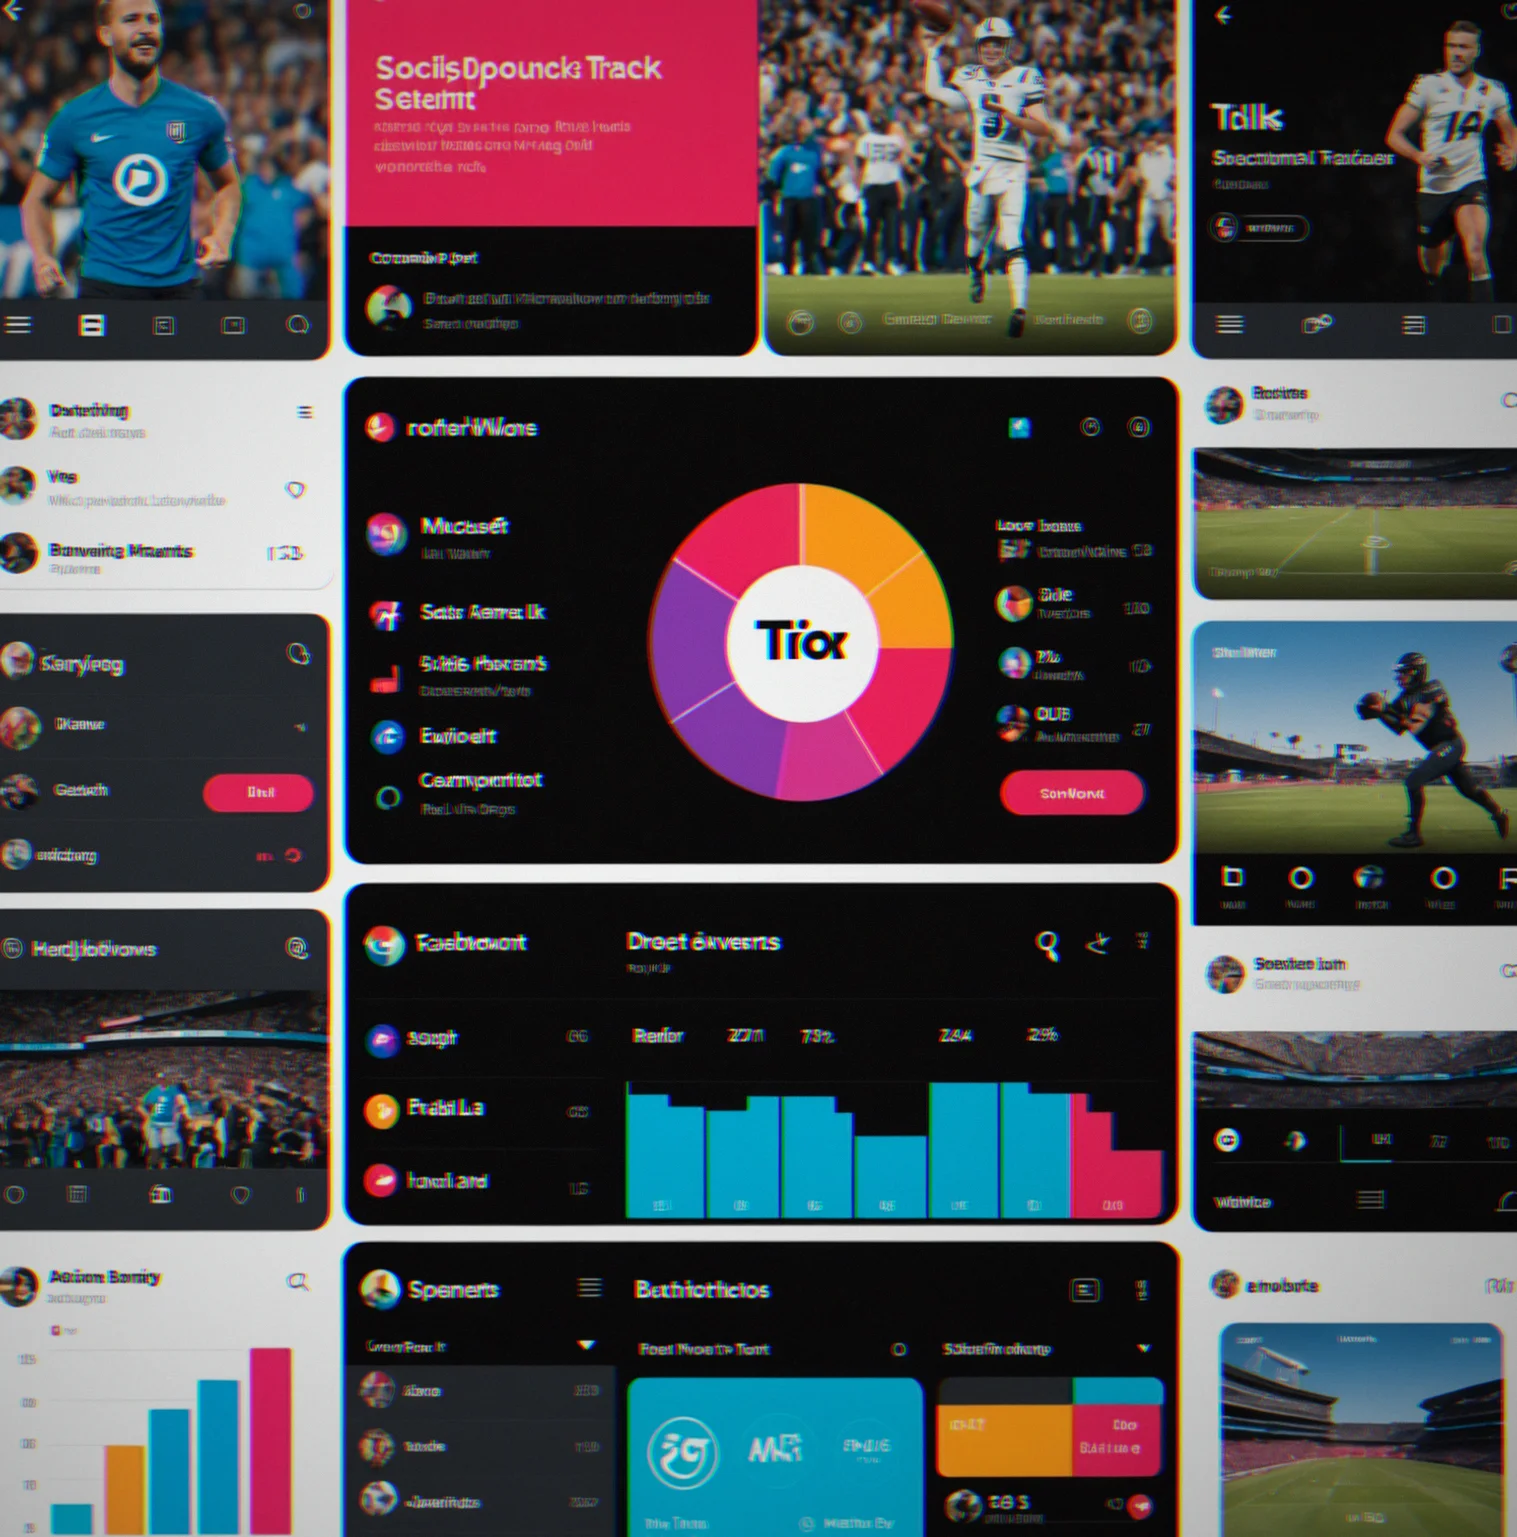
TikTok engagement is dropping. Instagram is flat. Twitter is growing. That combination means something. Usually audience fragmentation. She's losing the core people, picking up niche ones. Is that niche your space? Learning to read these patterns matters more than just watching follower counts go up.
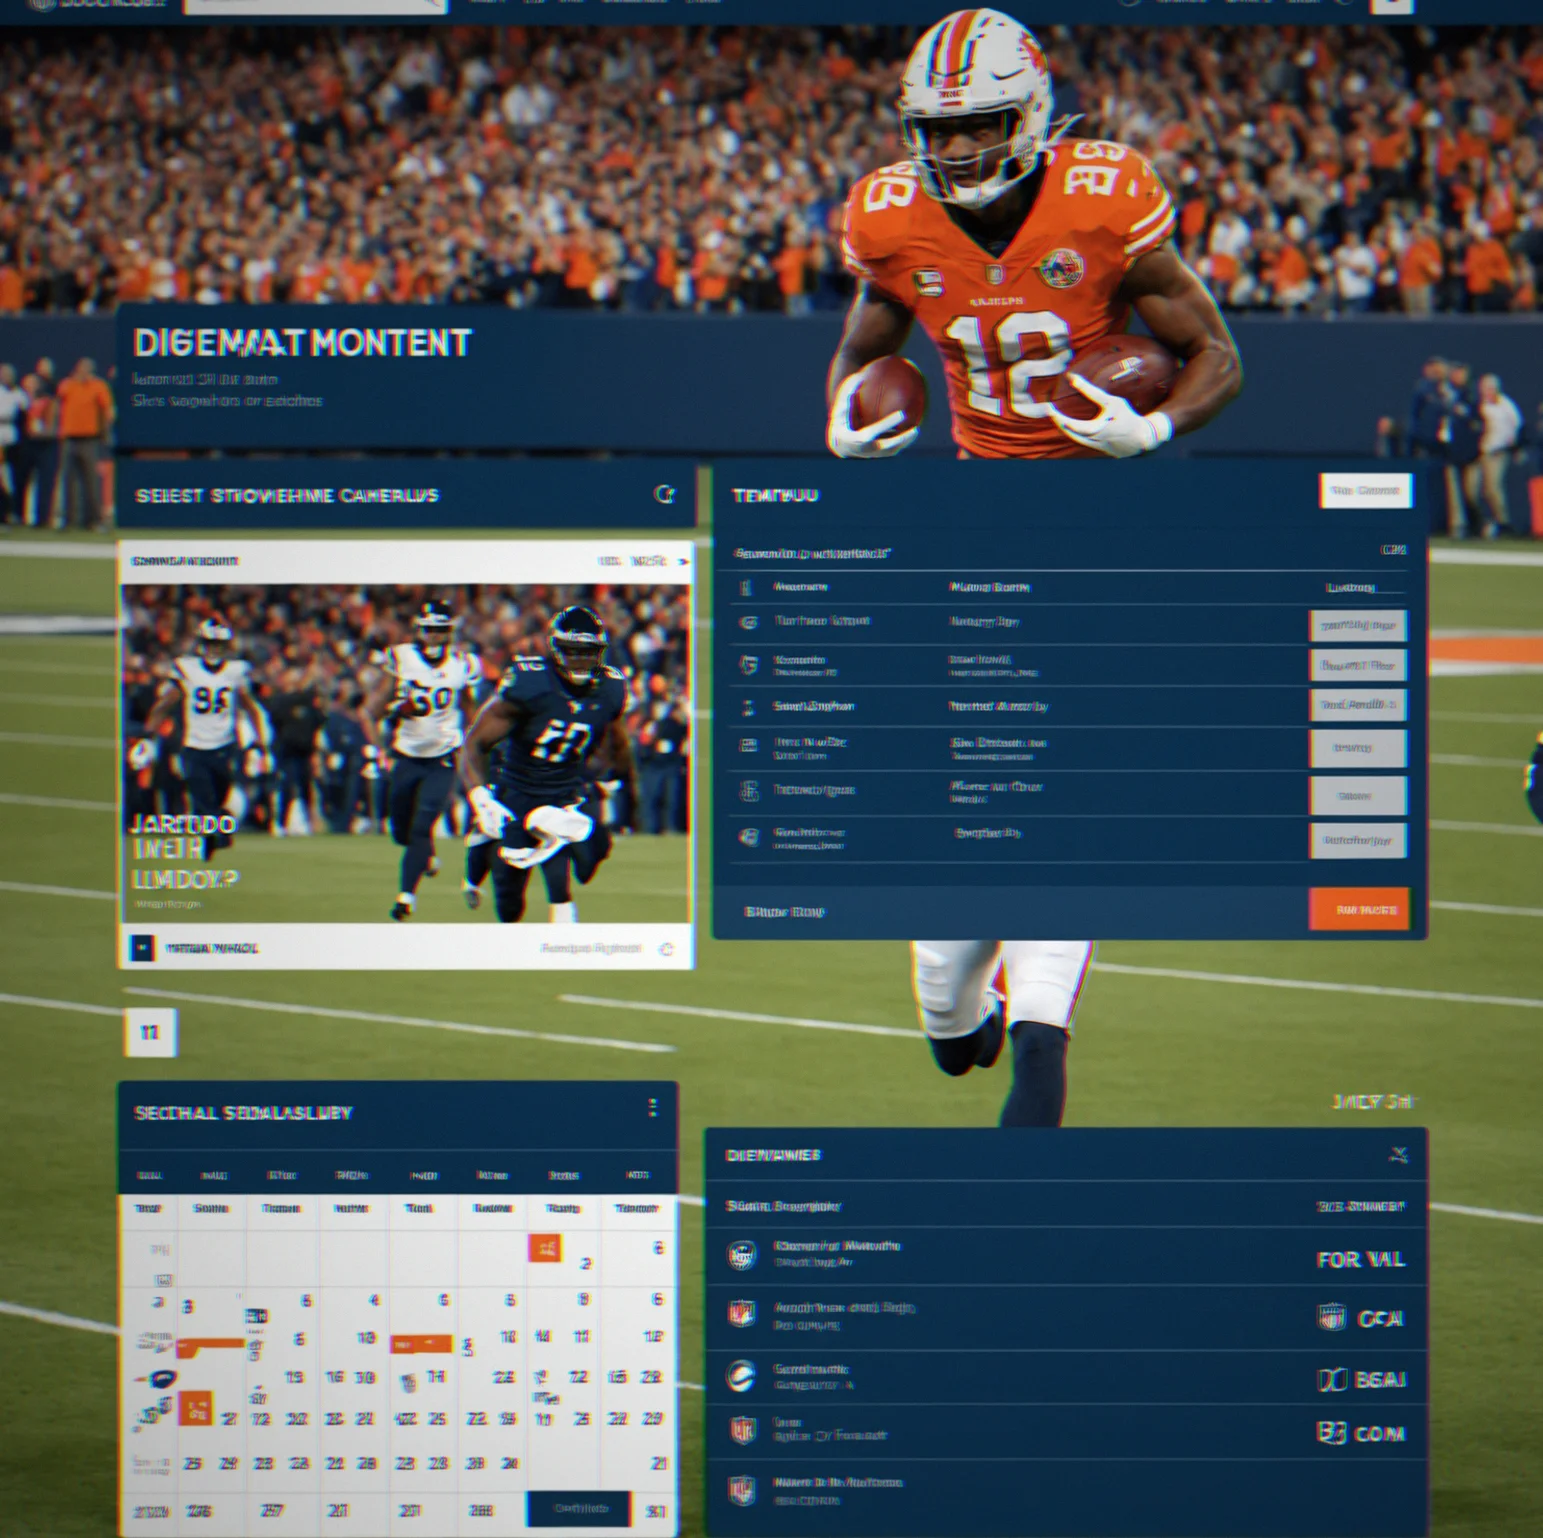
Pre-season hype. Playoff runs. A viral moment. Off-season trades. Injury comebacks. Each one creates a narrow window where an athlete's value jumps up then comes back down. You learn to spot these windows three or four weeks before they peak instead of reacting after everyone sees it.
You've got three top athletes available in your space. One's already taken. Your competitor just went after the second. Do you pay more to beat them or switch to a strong tier-2 athlete who actually fits your audience better? Neither choice is clearly right. You just deal with what happens next.
You have 2 million. Something unexpected will happen. An injury. Bad press. A rival move. How do you split your money so you can actually act fast when things break? That's what you need to figure out.
Not theory. Real sponsorship structure. How markets move, where money flows, what makes a $2M portfolio actually work versus one that sits flat.
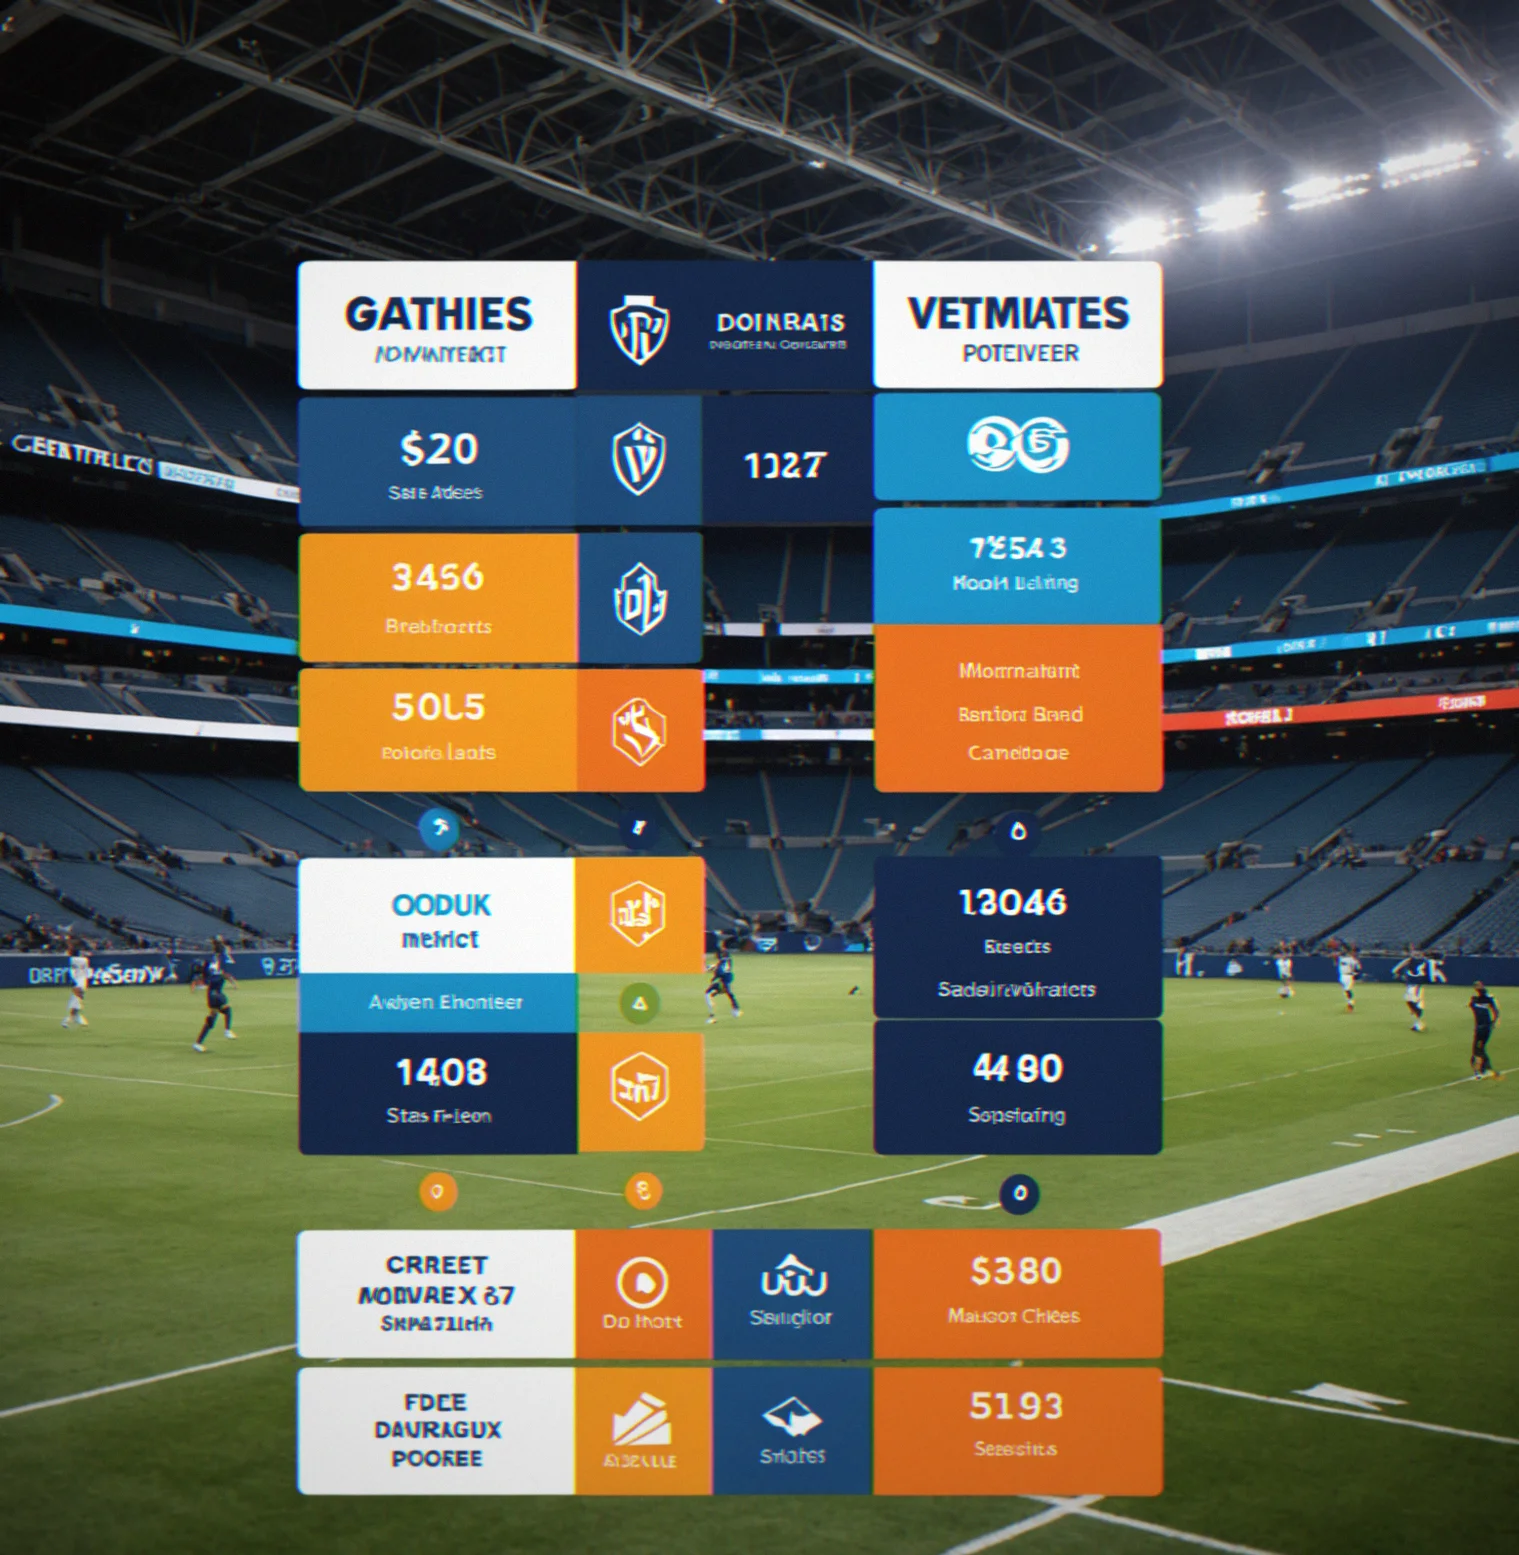
Tier 1 starts around $2M. Tier 2 lands between $400K and $1.2M. Those ranges aren't fixed though. One breakout game, a moment that goes viral, a playoff run—valuations jump 25 to 40% in two or three weeks. You learn to think ahead about value, not just price what's happening now.

Your brand's audience has to match the athlete's audience. That matters. When you've got 70% overlap at $600K, your cost per qualified impression looks one way. Drop to 40% overlap at $300K and it costs you way more per person who actually sees it. The game makes you calculate this across your whole roster instead of just guessing and moving on.
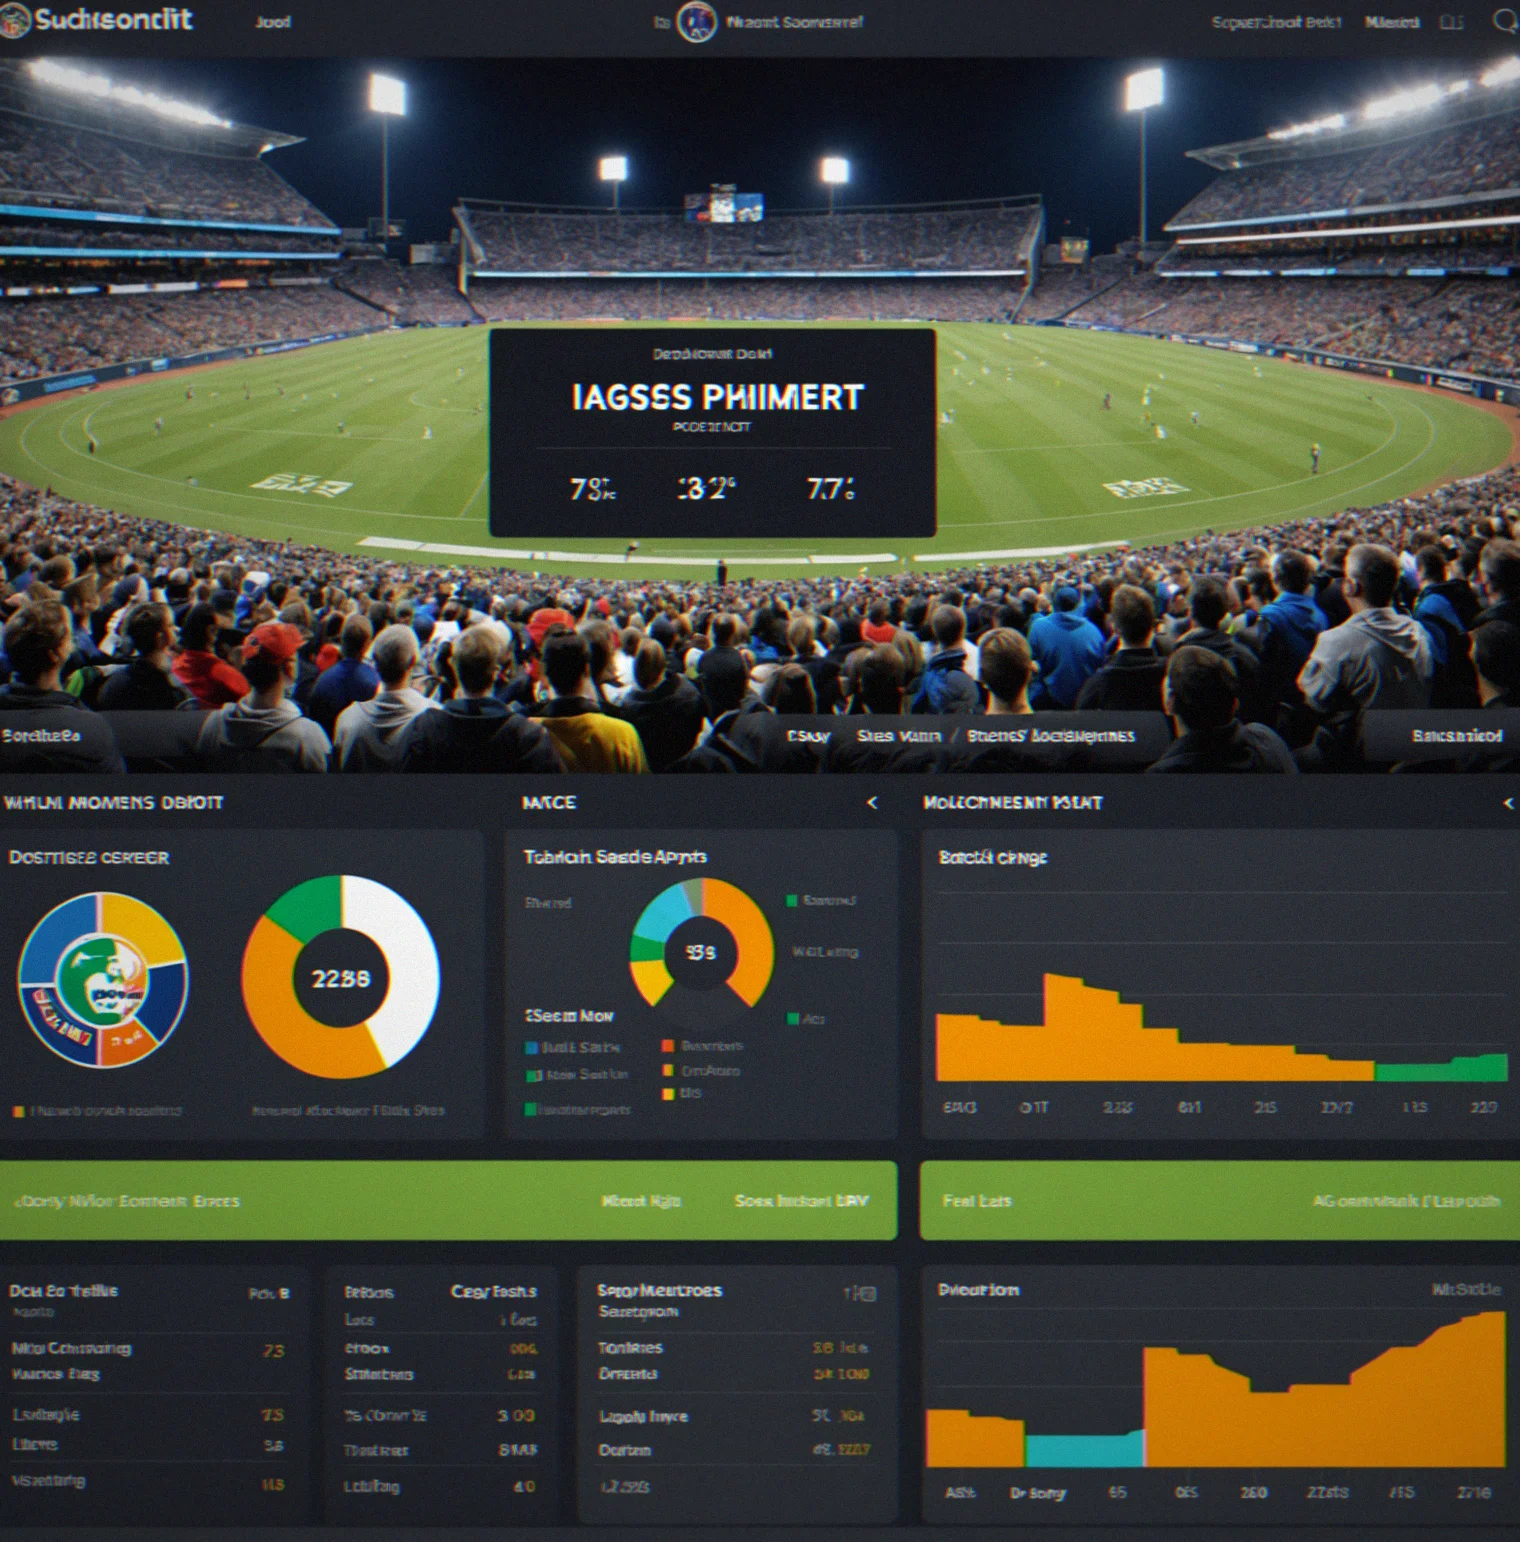
TikTok numbers climbing. Instagram stalled. Reddit getting cold. Twitter mixed and shifting. These signals don't always point the same direction, and you figure out which platform actually matters for your business, which momentum shifts are real red flags. Platform fragmentation tells you something important.
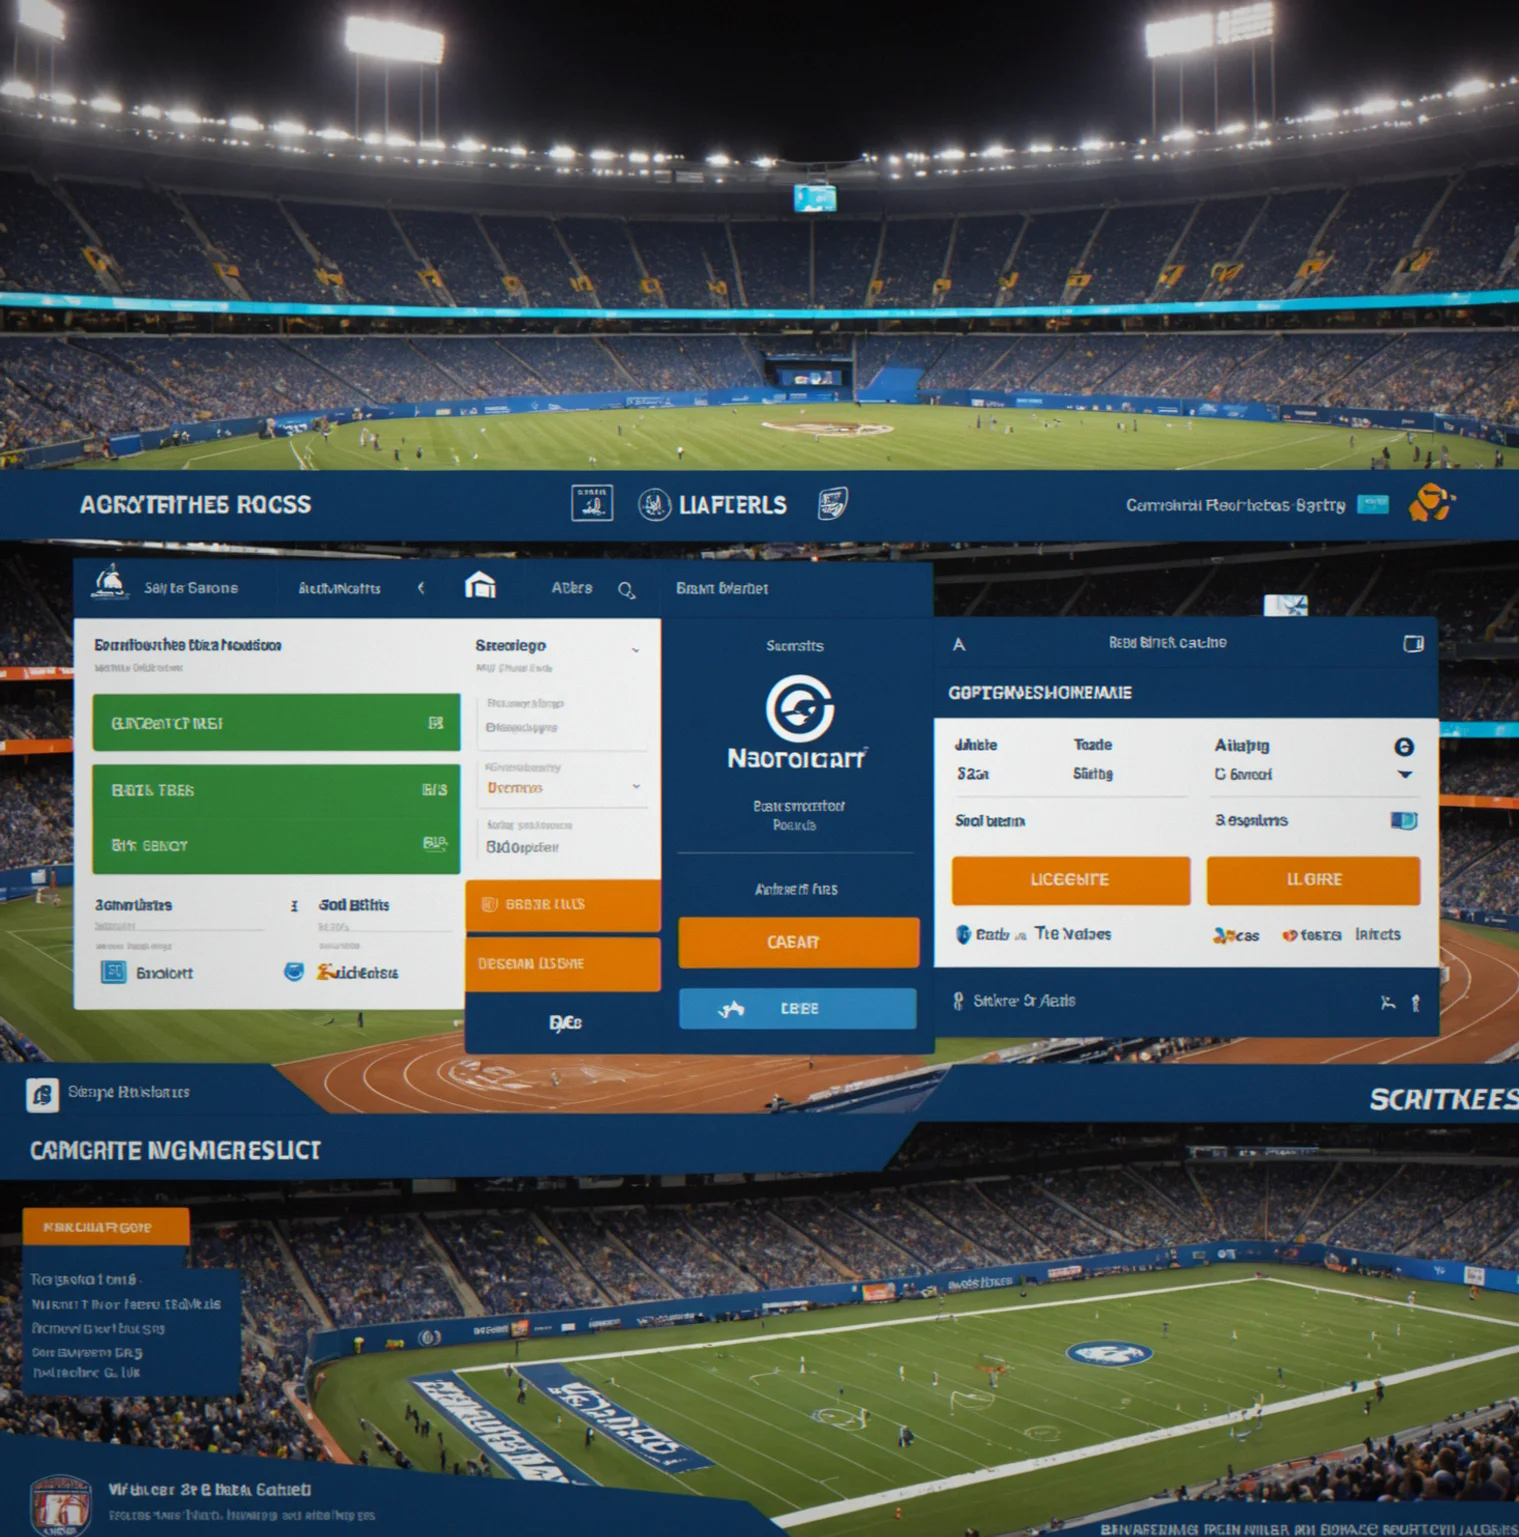
You see where your competitors spend. Inventory shrinks. Three tier-1 athletes in your space exist. One's already taken. Your competitor just outbid you on the second. Now you're looking at a stronger tier-2 option or pushing harder on names nobody's noticed yet. No choice is obviously right.
Lock a rising prospect at $250K now or wait for a scandal, an injury, something to crater her value to $150K later. Going early means you own the upside if things break right. Waiting is a gamble—she might sign elsewhere or the market already adjusted. The game makes you feel this tradeoff over and over.
Watch athletes climb through tiers. Someone sitting at $600K today could hit $1.8M in six weeks if the timing works out. Miss the window and they tank. The game doesn't care about your gut feeling — it cares whether you can spot the gap between what an athlete costs right now and what they're actually worth in a few weeks. You get sharp real fast.
You stop guessing at demographics and start calculating. Exact overlap percentages, what you're paying per qualified impression, how sensitive your whole return flips when valuations move. Sounds boring until you realize it's the difference between deploying $2M where it counts and just betting on whoever sounds biggest. Once you see it laid out, the picture becomes clear.
A competitor just snagged an athlete you had your eye on. Suddenly there's less to choose from. You either fight back or find someone else. Every round pushes you to notice where other buyers are putting their money and shift what you're doing next. There's no waoting around. It forces you to stay sharp.
TikTok engagement's dropping. Instagram looks flat. Twitter's climbing but people sound skeptical about it. The game teaches you which platform signals actually matter for what you're doing and what happens when you're getting mixed messages from different places. By the end of a few cycles you start to see fragmentation coming before it becomes a real problem.
Most cycles run 12 weeks. You'll see real sponsorship mechanics play out, make allocation decisions, and watch competitive moves shift the board. People usually want to know this stuff before they start.
A full cycle is 12 weeks of simulated time. Most people finish in 45 minutes to an hour, depending on how deep they dive into the numbers. You can pause between weeks if you need to step away.
It's built on real mechanics: tier valuations, audience overlap math, sentiment volatility, and competitive bidding. The simplifications are intentional — you're not dealing with contract law or activation rights. The core decisions map directly to how sponsorship portfolios actually get built though. Play three cycles and you'll spot gaps in your current budget approach.
Absolutely. Talent agents, team partnership leads, and sports property investors all play to understand buyer behavior. You learn how brands think about valuation and risk. That matters whether you're selling athlete access or trying to figure out why a competitor outbid you.
It does throw those at you. Mid-cycle an athlete gets injured and valuation tanks. A scandal breaks and sentiment craters in 48 hours. You have to reprioritize on the fly with whatever budget is left. That's the whole point — you learn to build portfolio reserves for chaos you can't predict.
Run the free trial. Two full cycles with end-of-cycle reporting. You'll see the tier matrix, competitive bid interface, and sentiment dashboard. If the mechanics work for you then unlock the full suite. If not you haven't spent anything.
Every Tuesday we break down where athletes are moving in sponsor tiers, how sentiment's shifting, and which windows are actually opening up across the market. Takes about five minutes to read, everything's based on real numbers, and there's no padding. You'll see the momentum changes that reshape valuations before they hit the mainstream.